Combining Multi-Chart Layouts with Indicators for Trade Setups on IQ Option

Trading on IQ Option has always been about speed and clarity. In my early days, I would open a chart, slap on a couple of indicators, and hope for the best. Sometimes it worked, but often it felt like a guessing game. The turning point came when I discovered multi-chart layouts. Suddenly, I could view different assets side by side, test setups across timeframes, and layer my indicators in a way that made sense.
But here’s the catch! Multiple charts can either be your biggest advantage or your worst distraction. Too many traders split their screens into six boxes, throw every indicator under the sun, and then wonder why they can’t decide. I’ve been there. The difference between success and failure lies in how you structure your multi-chart setup, how you match it with indicators, and how disciplined you stay in execution.
This article isn’t just theory; it’s my own journey of trial and error with IQ Option’s multi-chart feature. By the end, you’ll not only understand how to build smarter layouts but also how to use them for real trade confluence.

Ready to build smarter setups? Sign up on IQ Option and access multi-chart layouts instantly.
Why Multi-Chart Layouts Matter in Trading
When I first used IQ Option’s multi-chart view, I expected instant clarity. Instead, I got confused. Four different assets, four different directions, and me staring blankly at the screen. It was only after refining my approach that I realised the true power: multi-charting is about context, not complication.
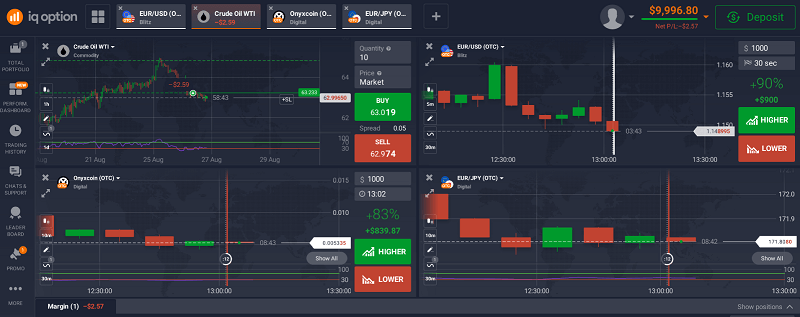
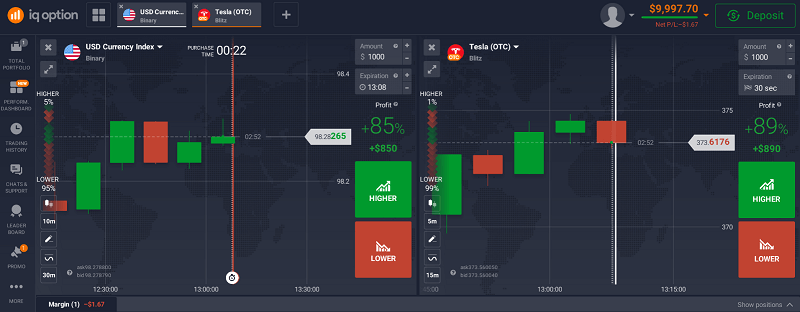
Looking at a single EUR/USD chart tells you what’s happening in isolation. But comparing EUR/USD with GBP/USD can highlight correlations. Placing a stock chart next to an index reveals whether the move is market-wide or stock-specific. Adding a commodity chart alongside forex might explain a sudden surge in CAD pairs.
In short, multi-chart layouts let you see the market as a living system rather than isolated dots.
The Mistakes I Made With Multi-Chart Layouts
I’ll be honest, my first attempts were disasters. I split my screen into six, loaded each with RSI, MACD, Bollinger Bands, and moving averages. The result? Chaos. No signal felt strong enough, and I hesitated until trades slipped away.
Three main mistakes stood out:
- Overloading charts with indicators, more didn’t mean better.
- No clear purpose for each chart; every window looked the same.
- Forcing signals to align, I wanted all six charts to scream the same thing before acting, which rarely happens.
Recognising these flaws was my first step toward building a usable system.
How I Learned to Build Smarter Multi-Chart Setups
Here are the steps to learn the multi-chart setups:

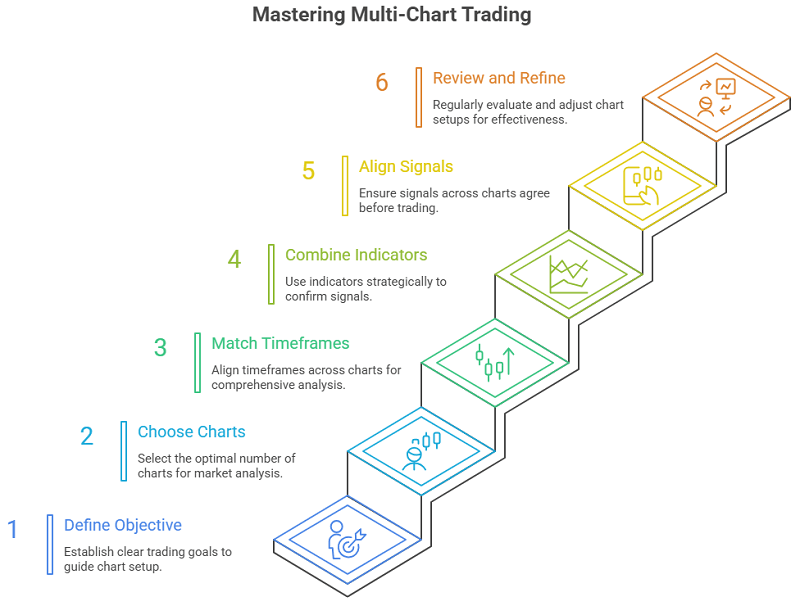
Step 1: Define Your Objective Before Splitting Charts
When traders first open multiple charts, the temptation is to fill each window with random assets. I made this mistake early on, ending up with clutter instead of clarity. The first step is to define what you’re trying to achieve. Are you comparing correlated assets (like EUR/USD and GBP/USD)? Or spotting divergences between a stock and its ETF? Without this clarity, your layout becomes noise. I found that when I set one clear objective, such as confirming trend strength across multiple pairs, my win rate improved because each chart had a role, not just a presence.
Step 2: Choose the Right Number of Charts
On IQ Option, you can split into two, four, or even six charts. The key is balance. Two charts help compare related markets, while four charts allow you to spot broader patterns across forex, stocks, and crypto simultaneously. Going beyond that can overwhelm unless you’re highly experienced. I personally stick to four charts max, where two track forex majors, one shows a crypto trend, and another gives me a commodities view. This gives me breadth without chaos.
Step 3: Match Timeframes to Your Strategy
One of the biggest breakthroughs for me came when I stopped using identical timeframes across all charts. Instead, I layered them. For instance, I would keep one chart on a higher timeframe (like 1-hour) to get a sense of market direction, while the other three charts zoomed into 5-minute or 15-minute setups for entries. This “top-down” view gave me confidence: I wasn’t just reacting to short-term noise but aligning trades with the broader trend.
Step 4: Combine Indicators Intelligently, Not Excessively
Indicators are like seasoning; too much ruins the dish. I tested different combinations across charts, and the best results came from pairing momentum indicators (RSI, MACD) with trend tools (moving averages). For example, my main chart might have RSI divergence highlighted, while a secondary chart confirms momentum with MACD. The goal isn’t to crowd each chart with five indicators, but to let each chart specialise in confirming a piece of the puzzle.
Step 5: Align Multi-Chart Signals Before Executing a Trade
Here’s where it all comes together. I never execute based on one chart alone anymore. For example, if my 15-minute chart shows RSI divergence but my 1-hour chart indicates strong bearish momentum, I’ll wait. But if the higher timeframe agrees with the short-term signal, I know I have confluence. This “cross-verification” has saved me from many losing trades that looked good in isolation but weak when zoomed out.
Step 6: Review and Refine Regularly
Multi-chart setups are not “set and forget.” Every two weeks, I review my layout, asking: Did these combinations give me clarity or confusion? I keep notes in my trade journal about which indicator + chart pairings improved my accuracy. Over time, I’ve eliminated what I call “false friends”; indicators that looked useful but didn’t add real value. The more I refined, the more intuitive my layouts became.
Experiment with your own layout today. Open a free demo on IQ Option and see how confluence changes your trades.
Practical Examples of Multi-Chart Layouts
Forex & Correlation Example
I placed EUR/USD on one chart and GBP/USD on another. When both trended in sync, my confidence in entries doubled. But when one diverged, I avoided trades, saving myself from false signals.
Crypto Momentum Example
With BTC/USDT on one chart and ETH/USDT on another, I noticed ETH often lagged BTC’s moves. Spotting BTC momentum helped me predict ETH’s breakout.
Stock & Index Example
Trading Tesla against the NASDAQ index showed me whether a surge was Tesla-specific or just the tech sector moving together. That clarity prevented me from misreading sentiment.

The Psychology of Multi-Chart Trading
It’s easy to drown in information. Early on, I thought having more screens made me smarter. In truth, it made me hesitant. My recovery came when I realised:
- Charts should filter noise, not create it.
- Indicators should confirm, not confuse.
- A setup is about confidence through clarity.
By treating each chart as a tool instead of a distraction, my confidence in executing trades skyrocketed. Many freelancers prefer multi-chart setups for efficiency.
Key Takeaways for Smarter Setups
Instead of filling screens with noise, remember:
- Define the role of each chart.
- Keep the number manageable.
- Layer timeframes for top-down clarity.
- Pair momentum and trend indicators.
- Seek confluence before acting.
- Refine regularly, and your system will evolve.
Final Thoughts: Turning Layouts Into Results
Multi-chart layouts aren’t magic, but when combined with indicators intelligently, they provide a roadmap. I’ve seen my win rate improve, not because I added more tools, but because I used them with intention.
And here’s the truth: no strategy works unless you put it into practice. IQ Option’s platform gives you the tools, but discipline and structure make the difference.
Don’t just read about smarter setups, practice them. Start trading with IQ Option and turn clarity into profit.