Combining RSI and Bollinger Bands in Binary Options: My Trading Journal

I still see that chart in my mind from early 2025. I had one of my first serious attempts at combining RSI and Bollinger Bands on EUR/USD during a volatile London session. Price touched the lower Bollinger Band, RSI dropped deeply into oversold range, and everything looked aligned. I entered a Call. In minutes the candle collapsed further and the trade expired out of the money.
That trade hurt, but it also forced me to rethink how I used indicators together. Since then I have refined a method that works better for short-expiry binary options. In what follows I walk you through my experiments, the setups that survived, and how I manage risk in real time.
If you want to test alongside me, open a Pocket Option account with my affiliate link and try these setups live.
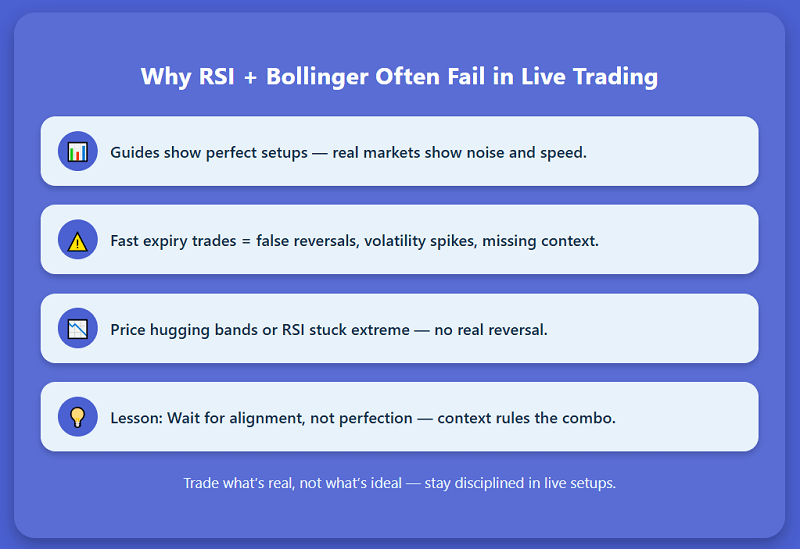
Why Most RSI + Bollinger Band Strategies Break in Live Trading
When I first looked up “RSI Bollinger Bands strategy for binary options,” I found many guides showing ideal charts and perfect entries. But almost none address the challenges of fast expiry trading: false signals, volatility squeezes, and missing context.
In many guides, price touching the band automatically triggers entry. In practice I found many failed setups. I also saw RSI clinging at extreme levels without reversal. Those losses encouraged me to build a more disciplined approach that asks: under what conditions do these signals align with reality?
Learning to Read These Indicators Together
RSI and Bollinger Bands are telling two sides of the same story. Bollinger shows where price sits relative to volatility, while RSI shows internal momentum strength or exhaustion. When they agree on direction, there is stronger conviction. When they diverge, it is often a trap.
My process now always starts with a volatility context. If bands are extremely tight, I know breakout chances exist but I won’t act until RSI confirms. If bands are already very wide, I expect trend pressure, not reversals. This judgment is what separates setups I trade from those I skip.
My Indicator Settings for Binary Use
I use standard settings with small tweaks:
- Bollinger Bands: 20-period moving average with ±2 standard deviations. On certain high volatility assets I reduce deviation slightly to 1.8 to increase responsiveness.
- RSI: 14 period by default. Instead of rigid 30/70 boundaries, I shift to dynamic zones (for example, 20–80 or 25–75) depending on how the market is behaving.
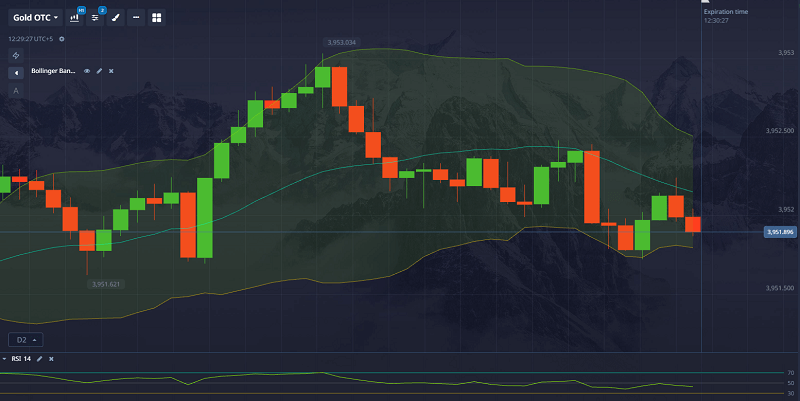
These settings are not fixed rules but starting points. I always monitor how the tools behave in live markets before trusting them.
Two Core Methods That Worked for Me
Over months of trial and error, I found two methods that survived enough losing streaks to be useful.
Method A: Band Bounce with RSI Reversal
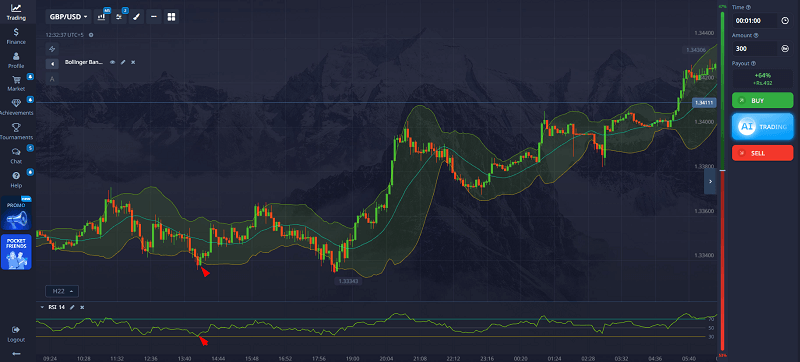
In this setup, price touches or briefly exits a Bollinger Band and then pulls back. At the same time, RSI dips into an extreme zone and begins to reverse. I enter only once price closes back inside the band in the direction of the reversal.
For example in March 2025 on GBP/USD, price broke slightly below the lower band, RSI dropped to about 25, then reversed upward. When the next candle closed bullish inside the band, I took a Call. It worked. That trade reinforced to me that hesitation and confirmation matter far more than speed.
Method B: Band Squeeze then Breakout, Confirmed by RSI
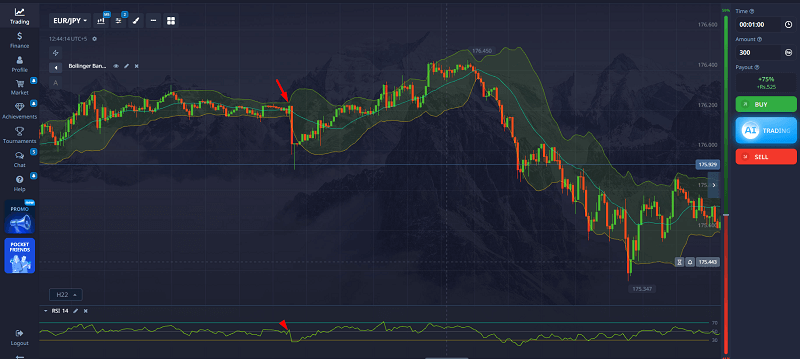
When Bollinger Bands contract for several bars, I anticipate a volatility expansion. When price breaks out above or below the bands, I check if RSI is turning in the same direction. If RSI supports the breakout, I take the trade. If it hesitates, I skip.
I tested this on EUR/JPY in April 2025. Bands were tight, price broke upward, RSI rose from midrange. That setup produced profit. But in a later Aussie session, bands squeezed and price broke out, but RSI stalled. I refused the trade and later saw the move reverse. That experience refined my discipline.
Trade Stories from My Journal
Trade 1: Bounce off Lower Band
Asset: USD/CHF, 5-minute expiry
Price touched the lower Bollinger Band. RSI dropped to ~23 and then reversed upward. I waited for a confirming candle closing inside the band before entering a Call. The trade expired in the money.
That trade nearly fooled me because the RSI felt too extreme. I almost skipped it. But I trusted the strong band reaction more than a fixed RSI boundary.
Trade 2: Failed Breakout
Asset: AUD/USD
Bands were tightly squeezed. The price broke above upper band and I saw RSI climb from 55 to 68. Thinking alignment was okay, I entered. Price reversed shortly and the trade lost.
That loss taught me that a breakout alone is not enough. RSI must continue its momentum beyond the breakout, not just approach it.
Trade 3: Clean Reversal
Asset: EUR/GBP
Price touched the upper band, RSI climbed above 80, then began to turn down. I waited one extra bar for confirmation, then entered a Put. It succeeded smoothly.
That trade reminded me that the best opportunities show patience; they don’t force themselves.
When the Combo Stops Working
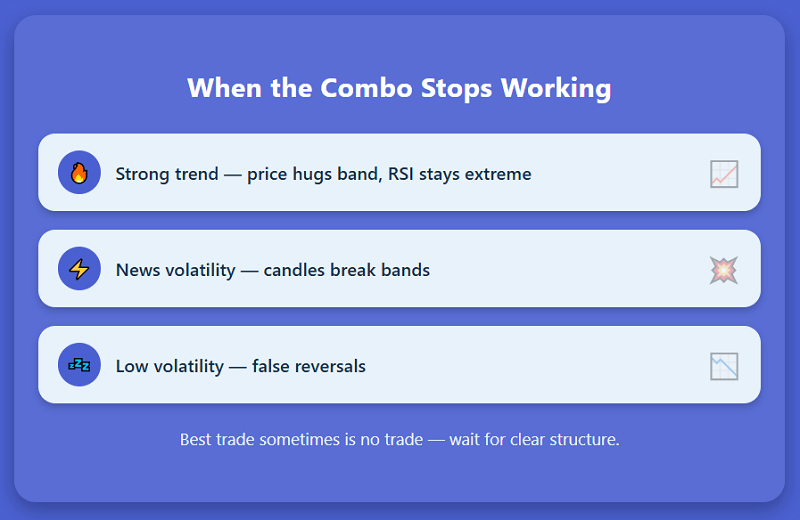
There are times when RSI and Bollinger fail together. In strong trending markets, price may ride the outer band for long periods and RSI clings at extreme values without reversing. In those conditions reversal setups often fail.
During news releases or extreme volatility, candles blow past bands, RSI spikes erratically, and signals lose coherence. In those moments I stay out until the market stabilizes.
When volatility collapses and bands compress too tightly, false reversals abound. I learned that skipping setups is sometimes my best trade.
My Entry / Exit Checklist
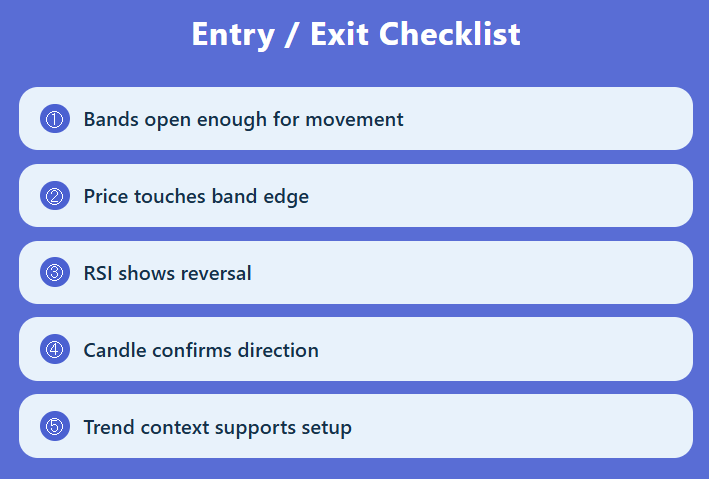
Before entering a trade I mentally run through this checklist:
- Bollinger Bands show a condition that allows movement (not extremely tight or extremely wide)
- Price touches or slightly breaches a band
- RSI is in an extreme zone and begins to reverse
- A confirmation candle closes in the direction of the intended trade
- The broader trend or context does not strongly contradict the signal
If all align, I enter. If one feels uncertain, I skip the setup. Skipping weak setups has saved me far more than chasing “perfect” ones.
If you want to follow this same flow with real charts, open your Pocket Option account and test these setups live.
Results and Realistic Expectations
From January through August 2025, I tested this RSI + Bollinger combo in about 200 trades. My net win rate after costs has been around 54 to 57 percent. I experienced losing streaks (five or six trades) but never blew capital because I size conservatively and stay disciplined.
This method will never be perfect, it is about tilting probabilities in your favor, not guaranteeing success.
What Makes My Approach Different
Many strategies online simplify this method into “price hits band, buy or sell” or “RSI below 30, buy.” Real trading is messier. My approach insists on context, confirmation, and alignment. I do not act unless the setup feels coherent across indicators and price structure.
I also treat patience as a critical filter. If I have to force a signal, I skip it. The best setups seem obvious, they don’t require convincing.
How to Practice Before Trading with Real Money
Spend several weeks in demo mode testing RSI + Bollinger combinations under different volatility conditions. Screenshot every winning and losing setup and analyze what went right or wrong.
Once your performance is stable, you can begin live testing with small amounts. Pocket Option supports small position sizes, making it ideal for cautious live testing. Sign up now and take advantage of a 50% deposit bonus to give your testing a bit of cushion.
Final Thoughts
Learning to combine RSI and Bollinger Bands in binary options taught me humility. Patterns and indicator signals are helpful hints, not guarantees. What matters is how you interpret them in real time, under pressure, and how you learn from both wins and losses.
If you apply this method with discipline, record your outcomes, and treat every trade as data, you will gradually refine your edge. When you feel ready, open your Pocket Option account, claim the 50% deposit bonus, and test these setups under live conditions. Let your charts teach you what works in your market.